Data and classes
Notebooks use three class groups for filtered experiments: Immune Cells, Invasive Tumor Set, and Non Invasive Tumor.
Gaussian-filtered inputs reached 92.60% classification accuracy versus 92.02% for original inputs: a 0.58 percentage-point difference in one saved run. The image viewer compares separate denoising outputs. It does not measure their classification benefit.
What remains uncertain: the classification comparison has no repeated-run estimate of variation. Image differences from the noisy input measure change, not restoration quality. No clean reference is supplied for the displayed patch.
Steps from image folders to classification results.
Folder structured histology patches are loaded by class.
Images are resized, normalized, and optionally filtered.
A ResNet based classifier is trained with early stopping.
Accuracy and confusion matrices are recorded in notebooks.
Inference requires separately obtained compatible checkpoints.
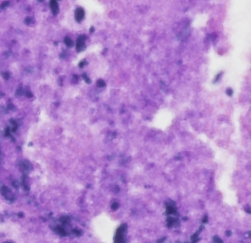
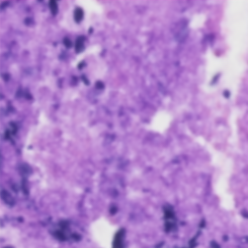
Included sample outputs show how each method changes stain texture, edge detail, and artifact patterns.
Mean absolute change and RMS change compare pixel values with the noisy input. A larger value means more change, not better denoising. These visual methods were not evaluated in the Gaussian-filtered classification comparison.
The saved notebook outputs compare original images against Gaussian filtered inputs with a sigma 5 preprocessing step.
Saved notebook results and requirements for repeating the experiment.
Notebooks use three class groups for filtered experiments: Immune Cells, Invasive Tumor Set, and Non Invasive Tumor.
Classical scripts apply Gaussian or median filters to class folders and write sibling filtered folders for training.
The repository contains model code and saved notebook outputs. Checkpoints are not bundled. To repeat inference, supply compatible weights and the input data.
Original CNN accuracy is 92.02 percent. Gaussian filtered CNN accuracy is 92.60 percent in the saved notebook run.
Supply an explicit checkpoint path when running Restormer. A missing checkpoint stops inference. This page displays saved images.